
Page 65 - SPARK OF MATH book 5
P. 65
(4-2) Line Graphs.
Title
600 Line
500 Segment
Label the vertical axis 400
300
200
horizontal axis
100 Label the
0 Point
Jan. Feb. Mar. Apr. May
Scale
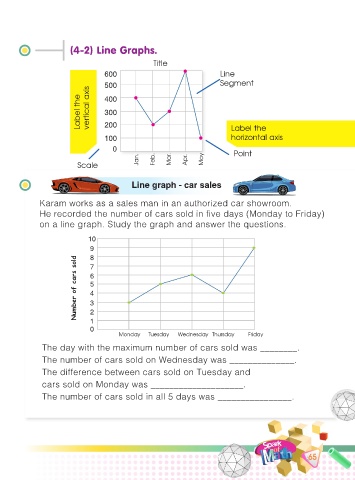
Line graph - car sales
Karam works as a sales man in an authorized car showroom.
He recorded the number of cars sold in five days (Monday to Friday)
on a line graph. Study the graph and answer the questions.
10
9
8
Number of cars sold 6
7
5
4
3
2
1
0
Monday Tuesday Wednesday Thursday Friday
The day with the maximum number of cars sold was ________.
The number of cars sold on Wednesday was ______________.
The difference between cars sold on Tuesday and
cars sold on Monday was ____________________.
The number of cars sold in all 5 days was ________________.
65