
Page 82 - SPARK OF MATH book 4
P. 82
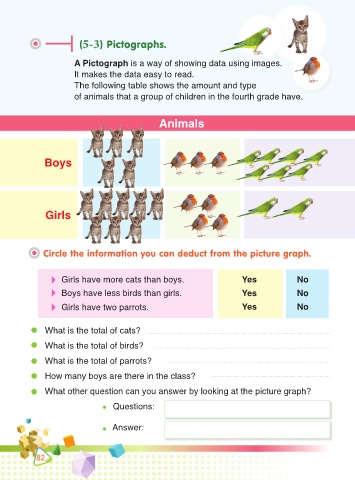
(5-3) Pictographs.


                           A Pictograph is a way of showing data using images.
                           It makes the data easy to read.

                           The following table shows the amount and type
                           of animals that a group of children in the fourth grade have.


                                                        Animals


                Boys


                 Girls


                Circle the information you can deduct from the picture graph.


                      Girls have more cats than boys.                               Yes                No

                      Boys have less birds than girls.                              Yes                No

                      Girls have two parrots.                                       Yes                No


                What is the total of cats?

                What is the total of birds?

                What is the total of parrots?


                How many boys are there in the class?

                What other question can you answer by looking at the picture graph?

                                            Questions:


                                            Answer:


              82