Page 83 - SPARK OF MATH book 4
P. 83

(5-4) Bar Graphs


                    A bar graph is a visual representation that helps organize

                    information easily. The information is drawn into rectangular bars with


                    heights or lengths proportional to the values that they

                    represent. A bar graph is also called a bar chart.


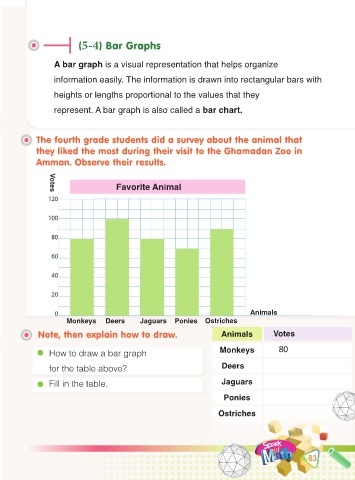
             The fourth grade students did a survey about the animal that
             they liked the most during their visit to the Ghamadan Zoo in

             Amman. Observe their results.


                                         Favorite Animal
                  Votes


                                                                                       Animals
                        Monkeys      Deers       Jaguars     Ponies    Ostriches
              Note, then explain how to draw.                                Animals           Votes


                  How to draw a bar graph                                   Monkeys

                  for the table above?                                       Deers

                  Fill in the table.                                         Jaguars

                                                                              Ponies


                                                                            Ostriches


                                                                                                           83
   78   79   80   81   82   83   84   85   86   87   88